Capture Engine tabs
The following tabs allow you to configure properties for a connected Capture Engine:
• Home: This tab displays a summary of Capture Engine properties and network settings. Graphical links allow you to quickly access other available tabs for the Capture Engine.
NOTE: The Capture Storage summary displayed in the Home tab displays the amount of space available for storing capture data on the Capture Engine. This amount is the free space available on the Capture Engine less a reserve of additional unused disk space. The reserve is calculated as the sum of 11 GB plus 3% of the total disk space on the Capture Engine (a minimum of 5 GB, and a maximum of 1 TB). See Configuring general options to allocate the amount of disk space for a capture.
• Captures: This tab lists all defined captures, along with summary information about each capture where ‘Capture to Disk’ was enabled. See Capture Engine Captures tab.
• Forensics: This tab displays the capture sessions available on the Capture Engine. You can select one of the capture sessions, display its data in the Timeline graph, and then perform a forensic search on specific parts of the data. See Forensics capture on a Capture Engine and Forensic search from the Forensics tab.
• Files: This tab displays all capture files saved to the Capture Engine. The data folder for saving these files is defined in the General view of the Capture Engine Wizard. See Configuring and updating Capture Engine settings.
You can select one or more of the capture files and then perform a forensic search on the files. See Forensics capture on a Capture Engine and Forensic search from the Files tab.
• Forensic Searches: This tab displays all forensic searches, whether in progress or complete, on the Capture Engine. Forensic search listings are displayed in the Forensic Searches tab until you close a forensic search window and delete the search when prompted, or select the forensic search listing and click Delete.
When a forensic search is complete, a notification is sent using the ‘Forensic Search.’ If you have set up a notification using that source, you are notified with whatever action type you set up (email, SNMP, trap, etc.) when the search is complete.
• Log: This tab provides a log which collects messages from program processes and events, including program start and stop, notifications, etc. See Capture Engine global events.
• Adapters: This tab displays all available recognized capture adapters for the Capture Engine. Multiple captures can use the same adapter, or each a different adapter, as long as each capture has one valid adapter selected.
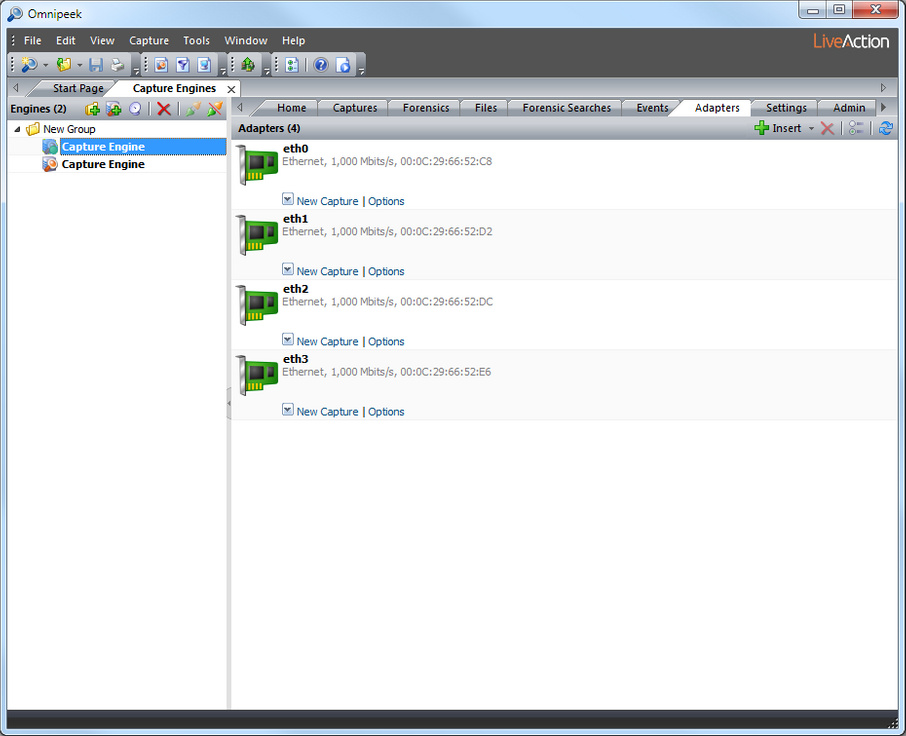
To select an adapter for an individual capture, see Configuring adapter options.
• Settings: This tab displays the following sub-tabs:
• Graphs: This tab allows you to create and manage graph templates, which can be used by any Capture Engine capture window on that engine. See Capture Engine graph templates.
• Filters: This tab displays a list of all filters present on the Capture Engine and a means of managing them independent of any particular Capture Engine capture window. See Capture Engine filters tab.
• Alarms: This tab provides a list of all the alarms present on the Capture Engine and a means of managing them independent of any particular Capture Engine capture window. See Capture Engine alarms tab.
• Notifications: This tab provides a means of defining Actions (responses to a notification) and invoking these Actions when a notification of a specified severity is generated by an event or process running on a Capture Engine. See Sending Notifications.
• Protocol Translations: This tab provides a list of all the protocol translations defined on the Capture Engine. You can create, edit, duplicate, and delete protocol translations. See Protocol translations.
• Analysis Modules: This tab displays summary information about each analysis module installed on the Capture Engine. See Capture Engine analysis modules.
• Admin: This tab displays the following sub-tabs:
• Audit Log: This tab lists all available information regarding events taking place on the Capture Engine. See Capture Engine audit log.
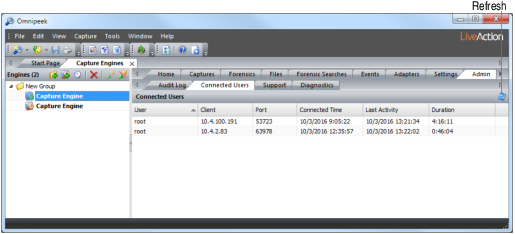
• Connected Users: This tab shows all users currently connected to the Capture Engine. Click to refresh the list.
 p
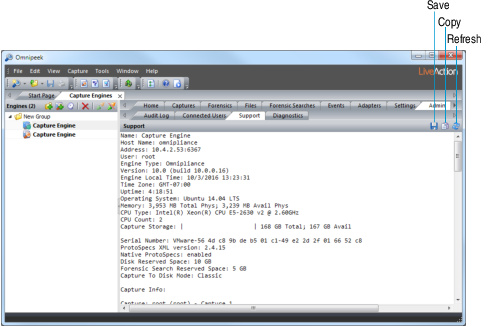
p• Support: This tab displays support information that is useful in troubleshooting your Capture Engine. You can save the support information to a text file, copy selected text, and refresh the current view.
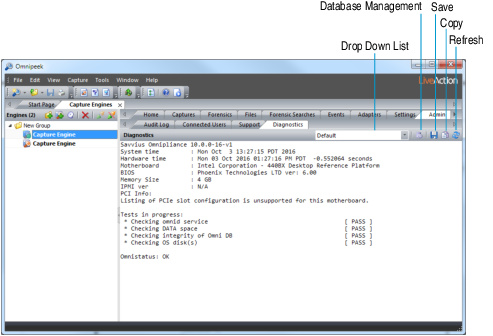
• Diagnostics: This tab allows you to run a diagnostic test on the connected engine and display the results inside a text box. You can save the diagnostics information to a text file, copy selected text, and refresh the current view. Additionally, you can perform database management which does an integrity check on the database, vacuums (cleans) the database, and reindexes the database.
• Trust Table (Capture Engine for Omnipeek (Windows) only): This tab allows you to associate 802.11 WLAN addresses with a trust value: Trusted, Known, or Unknown. These values are used by the WLAN and Summary views of a Capture Engine capture window. See Using the Name Table.